> ## Documentation Index
> Fetch the complete documentation index at: https://docs.idun-group.com/llms.txt
> Use this file to discover all available pages before exploring further.
# Google Cloud Logging
> Set up Google Cloud Logging to capture structured logs from your agents.
Set up Google Cloud Logging to send structured logs from your agents to Google Cloud for centralized log management.
Before starting, complete the [quickstart guide](/quickstart) to have an agent running on Idun Engine.
## Set up GCP Logging observability
1. Create a Google Cloud project if you do not have one
2. Enable the **Cloud Logging API** in your project
3. Verify that the environment where your agent runs has credentials with permission to write logs (the `Logs Writer` role)
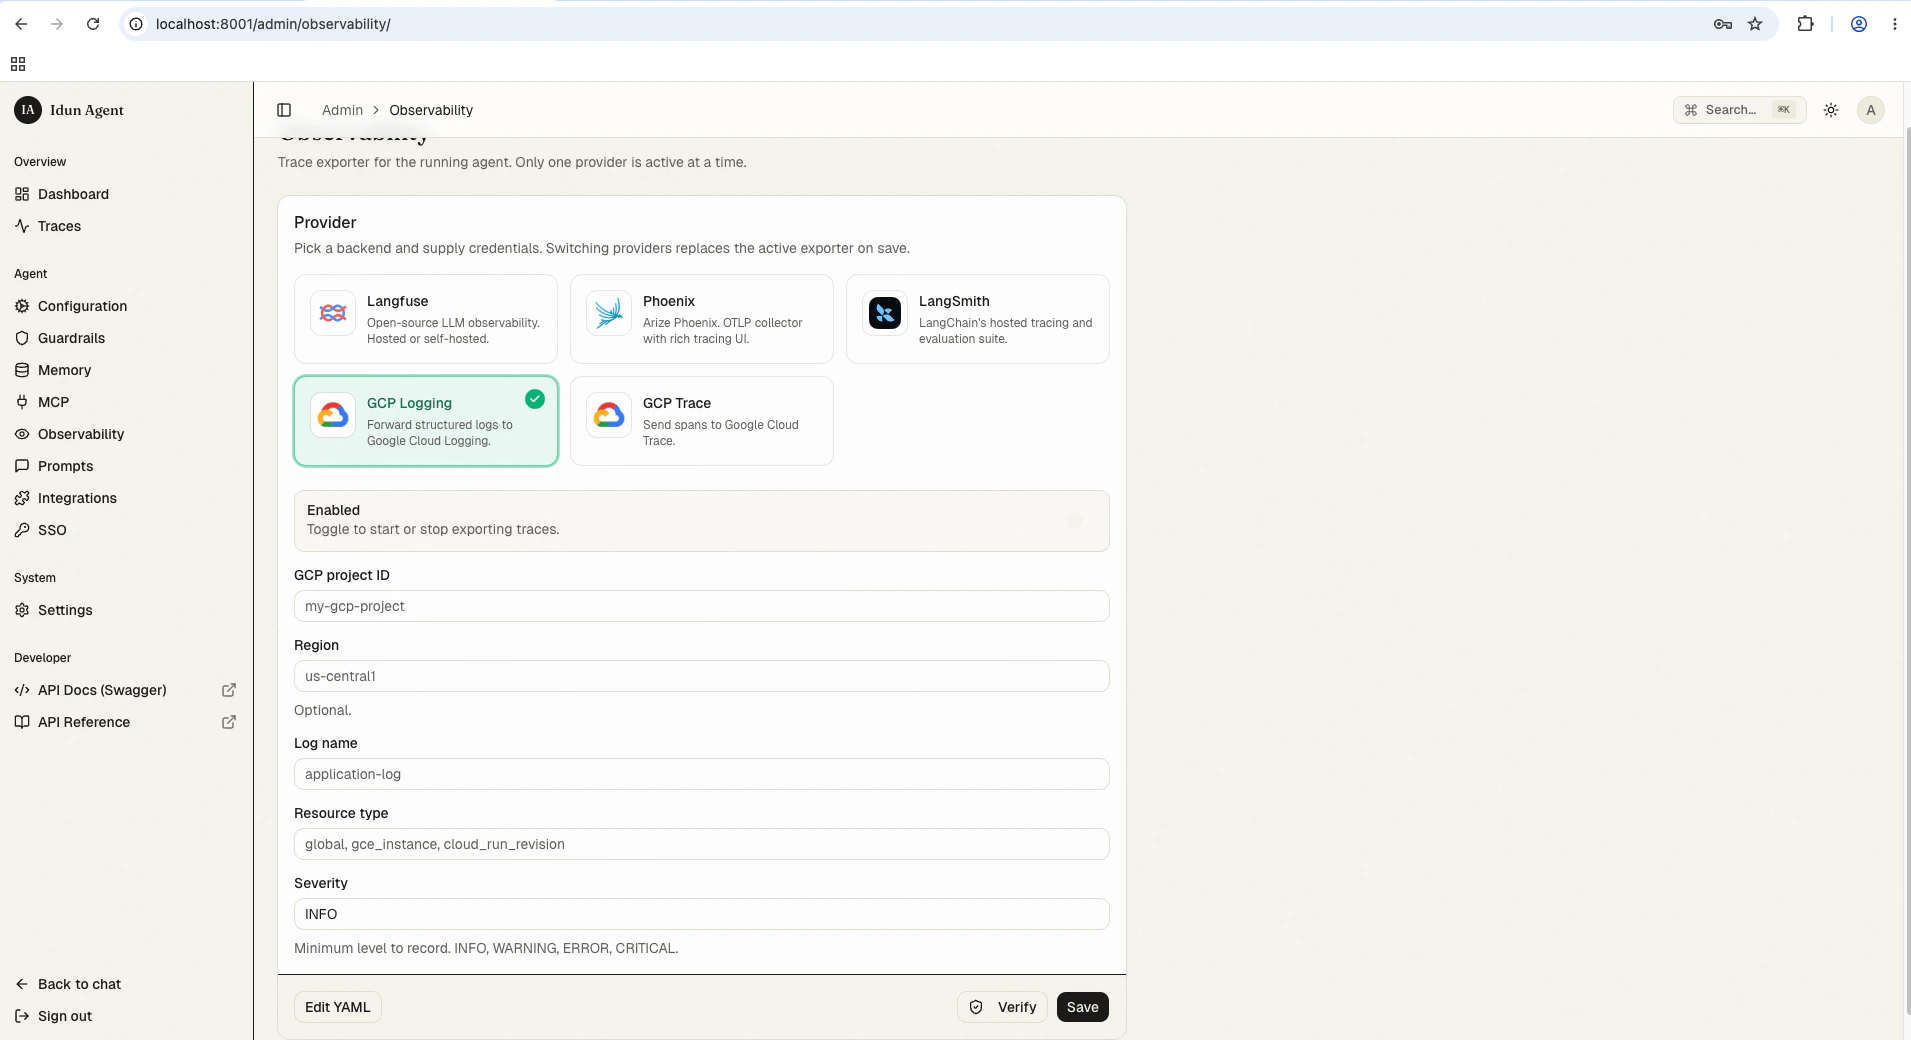
Open the running standalone at `/admin/observability/` and click **GCP Logging**. Fill in:
* **GCP project ID**: Your Google Cloud project ID
* **Region**: (Optional) Region/zone associated with the resource (e.g., `us-central1`)
* **Log name**: Identifier for the log stream (e.g., `application-log`)
* **Resource type**: Resource type label (e.g., `global`, `gce_instance`, `cloud_run_revision`)
* **Severity**: Minimum level to record (`INFO`, `WARNING`, `ERROR`, `CRITICAL`)
 Save the form. The reload pipeline re-instantiates the engine with the new observability config; subsequent agent runs ship structured logs to GCP.
Alternatively, configure GCP Logging in your `config.yaml` for first-boot seeding or engine-only mode:
```yaml config.yaml theme={"theme":{"light":"github-light","dark":"github-dark"}}
observability:
- provider: "GCP_LOGGING"
enabled: true
config:
project_id: "my-gcp-project"
log_name: "idun-agent-logs"
resource_type: "cloud_run_revision"
severity: "INFO"
```
## View log data
Once your agent is running with observability enabled:
1. Interact with your agent through the chat UI at `/` or the API at `/agent/run`
2. Open the [Google Cloud Console](https://console.cloud.google.com/)
3. Navigate to **Logging** > **Logs Explorer**
Filter by the **Log Name** you configured to see your agent's logs.
## Best practices
* **Use structured logging**: The agent platform sends structured logs, which are easier to query in GCP
* **Set appropriate severity**: Filter out debug noise in production by setting severity to `INFO` or `WARNING`
## Troubleshooting
1. **Check permissions**: Verify the `Logs Writer` role is assigned to the agent's service account
2. **Check log name**: Confirm you are filtering by the correct log name in Logs Explorer
## Next steps
Add distributed tracing alongside structured logs in Google Cloud.
See the same agent runs in the bundled admin UI without GCP setup.
Run the standalone next to your logs with managed Postgres.
Save the form. The reload pipeline re-instantiates the engine with the new observability config; subsequent agent runs ship structured logs to GCP.
Alternatively, configure GCP Logging in your `config.yaml` for first-boot seeding or engine-only mode:
```yaml config.yaml theme={"theme":{"light":"github-light","dark":"github-dark"}}
observability:
- provider: "GCP_LOGGING"
enabled: true
config:
project_id: "my-gcp-project"
log_name: "idun-agent-logs"
resource_type: "cloud_run_revision"
severity: "INFO"
```
## View log data
Once your agent is running with observability enabled:
1. Interact with your agent through the chat UI at `/` or the API at `/agent/run`
2. Open the [Google Cloud Console](https://console.cloud.google.com/)
3. Navigate to **Logging** > **Logs Explorer**
Filter by the **Log Name** you configured to see your agent's logs.
## Best practices
* **Use structured logging**: The agent platform sends structured logs, which are easier to query in GCP
* **Set appropriate severity**: Filter out debug noise in production by setting severity to `INFO` or `WARNING`
## Troubleshooting
1. **Check permissions**: Verify the `Logs Writer` role is assigned to the agent's service account
2. **Check log name**: Confirm you are filtering by the correct log name in Logs Explorer
## Next steps
Add distributed tracing alongside structured logs in Google Cloud.
See the same agent runs in the bundled admin UI without GCP setup.
Run the standalone next to your logs with managed Postgres.