> ## Documentation Index
> Fetch the complete documentation index at: https://docs.idun-group.com/llms.txt
> Use this file to discover all available pages before exploring further.
# Observability
> Monitor, trace, and debug your agents with built-in integrations for popular observability platforms.
Idun Engine includes built-in observability backed by OpenTelemetry auto-instrumentation. It captures traces, logs, and metrics from your agents with minimal configuration.
The standalone runtime always captures traces locally into its own DB-backed [trace store](/observability/traces). External providers (Langfuse, Phoenix, LangSmith, GCP Trace) stack on top: configure one or more in the admin panel or `config.yaml`, and the engine fans spans out to local storage and every enabled provider.
## Supported providers
Open-source observability and analytics for LLM applications. Self-hosted or cloud.
AI observability for tracing, evaluation, and troubleshooting. Cloud or self-hosted.
Debugging, testing, evaluating, and monitoring for LangChain-based agents.
Distributed tracing to find latency bottlenecks in Google Cloud environments.
Structured log management and analysis in Google Cloud.
## How it works
When you attach an observability configuration to an agent, the platform automatically instruments the agent runtime. Depending on the provider, you get:
* **Traces** showing agent execution flow, LLM calls, and tool invocations
* **Latency metrics** for each step in the agent graph
* **Cost tracking** based on token usage
* **Error traces** with full context for debugging
* **Structured logs** for centralized log analysis
## Configuration
Add an `observability` section to your `config.yaml` with the provider and its credentials:
```yaml config.yaml theme={"theme":{"light":"github-light","dark":"github-dark"}}
observability:
- provider: "LANGFUSE"
enabled: true
config:
public_key: "pk-lf-..."
secret_key: "sk-lf-..."
host: "https://cloud.langfuse.com"
```
The `observability` key is a list, and you can attach more than one provider at a time; each entry is lazy-loaded and the engine fans spans out to every enabled provider. See the provider-specific pages for the full list of fields each provider requires.
Navigate to `/admin/observability/` in the running standalone. The catalog shows the supported providers: Langfuse, Arize Phoenix, LangSmith, GCP Trace, GCP Logging.
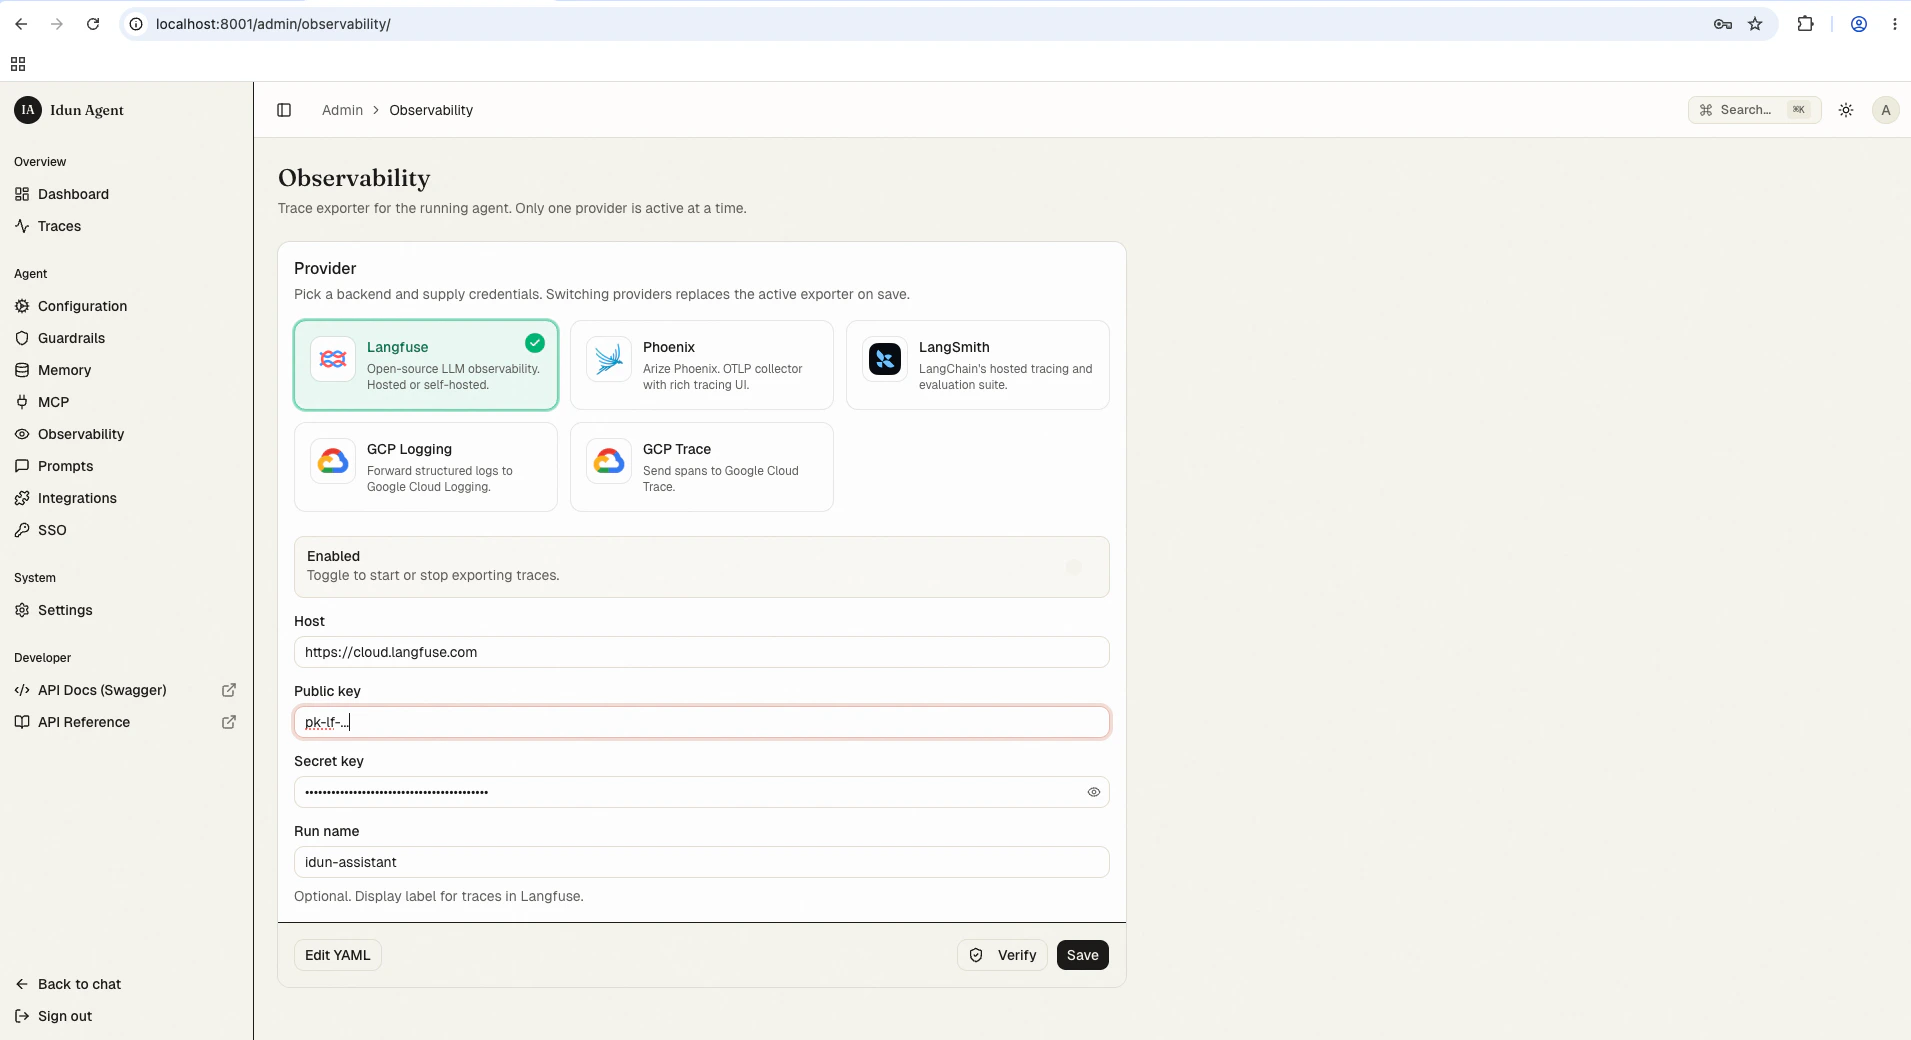 Click the provider you want and fill in the credentials. The reload pipeline re-instantiates the engine with the new observability config when you save.
## Probing the connection programmatically
The configured observability provider can be smoke-tested without going through the admin UI. `POST /admin/api/v1/observability/check-connection` runs the same probe the admin Test-connection button uses and returns a `StandaloneConnectionCheck`:
```bash theme={"theme":{"light":"github-light","dark":"github-dark"}}
curl -sX POST http://localhost:8000/admin/api/v1/observability/check-connection \
--cookie "$IDUN_SESSION_COOKIE"
```
Langfuse, Phoenix, and LangSmith providers get an HTTP HEAD (falling back to GET on `>= 400`) against their configured endpoint; success means an HTTP status under 500:
```json theme={"theme":{"light":"github-light","dark":"github-dark"}}
{
"ok": true,
"details": { "provider": "LANGFUSE", "host": "https://cloud.langfuse.com", "status": 200 },
"error": null
}
```
GCP\_TRACE and GCP\_LOGGING return `ok: true` with a `details.note` flagging that the runtime auth check needs GCP credentials and was not attempted; the probe only validates that `project_id` is set:
```json theme={"theme":{"light":"github-light","dark":"github-dark"}}
{
"ok": true,
"details": {
"provider": "GCP_TRACE",
"projectId": "my-project",
"note": "config valid; runtime auth check requires GCP credentials"
},
"error": null
}
```
The probe returns HTTP 404 when no provider is configured. Otherwise every outcome is HTTP 200 with `ok` reflecting reachability, runs under a 5-second timeout, and never raises (`services/connection_checks.py`).
The route is admin-authenticated: under `IDUN_ADMIN_AUTH_MODE=password` you need the session cookie minted by `POST /admin/api/v1/auth/login`. Use this in pre-deploy gates to confirm credentials still resolve before flipping traffic.
## Next steps
Browse, search, and inspect AG-UI run events captured by the standalone's trace store.
The OpenTelemetry event shape the engine emits.
Wire your own span handler when the built-in providers don't fit.
Click the provider you want and fill in the credentials. The reload pipeline re-instantiates the engine with the new observability config when you save.
## Probing the connection programmatically
The configured observability provider can be smoke-tested without going through the admin UI. `POST /admin/api/v1/observability/check-connection` runs the same probe the admin Test-connection button uses and returns a `StandaloneConnectionCheck`:
```bash theme={"theme":{"light":"github-light","dark":"github-dark"}}
curl -sX POST http://localhost:8000/admin/api/v1/observability/check-connection \
--cookie "$IDUN_SESSION_COOKIE"
```
Langfuse, Phoenix, and LangSmith providers get an HTTP HEAD (falling back to GET on `>= 400`) against their configured endpoint; success means an HTTP status under 500:
```json theme={"theme":{"light":"github-light","dark":"github-dark"}}
{
"ok": true,
"details": { "provider": "LANGFUSE", "host": "https://cloud.langfuse.com", "status": 200 },
"error": null
}
```
GCP\_TRACE and GCP\_LOGGING return `ok: true` with a `details.note` flagging that the runtime auth check needs GCP credentials and was not attempted; the probe only validates that `project_id` is set:
```json theme={"theme":{"light":"github-light","dark":"github-dark"}}
{
"ok": true,
"details": {
"provider": "GCP_TRACE",
"projectId": "my-project",
"note": "config valid; runtime auth check requires GCP credentials"
},
"error": null
}
```
The probe returns HTTP 404 when no provider is configured. Otherwise every outcome is HTTP 200 with `ok` reflecting reachability, runs under a 5-second timeout, and never raises (`services/connection_checks.py`).
The route is admin-authenticated: under `IDUN_ADMIN_AUTH_MODE=password` you need the session cookie minted by `POST /admin/api/v1/auth/login`. Use this in pre-deploy gates to confirm credentials still resolve before flipping traffic.
## Next steps
Browse, search, and inspect AG-UI run events captured by the standalone's trace store.
The OpenTelemetry event shape the engine emits.
Wire your own span handler when the built-in providers don't fit.