> ## Documentation Index
> Fetch the complete documentation index at: https://docs.idun-group.com/llms.txt
> Use this file to discover all available pages before exploring further.
# Local trace store
> Use the standalone runtime's built-in trace store and admin UI to inspect every agent run, LLM call, tool invocation, and cost.
The standalone runtime ships with a built-in trace store. Every agent run is captured automatically, written to the standalone database, and served through the bundled admin UI. No external collector, no extra config: it is on by default.
This page covers what the trace store captures, how to read the trace UI, and when to switch from SQLite to Postgres for production.
## What the trace store captures
The trace store consumes OpenTelemetry spans emitted by the engine's existing instrumentation (LangChain, ADK, MCP, guardrails). On boot, the standalone attaches its own `SpanExporter` to the engine's `TracerProvider`; spans flow through a bounded queue into an asyncio writer, land in the `standalone_trace` and `standalone_span` tables, and are served back through `/admin/api/v1/traces` to the trace UI.
```mermaid theme={"theme":{"light":"github-light","dark":"github-dark"}}
flowchart TB
Agent["Agent run"] --> TP["Engine TracerProvider"]
TP --> Exporter["Standalone SpanExporter
(bounded queue + async writer)"]
Exporter --> DB[("standalone_trace
+ standalone_span")]
DB --> UI["/admin/api/v1/traces
(trace UI)"]
```
If no observability provider is configured, the runtime self-installs `LangChainInstrumentor` so spans are still produced. External providers stack on top of the local store: Langfuse and LangSmith ship spans through their own paths while the local store captures the same runs in parallel; Phoenix, GCP Trace, and other OTel-based providers attach to the same `TracerProvider` as the local exporter and fan out from there.
You always have a local copy.
## Trace list view
The list view at **Traces** shows one row per agent run.
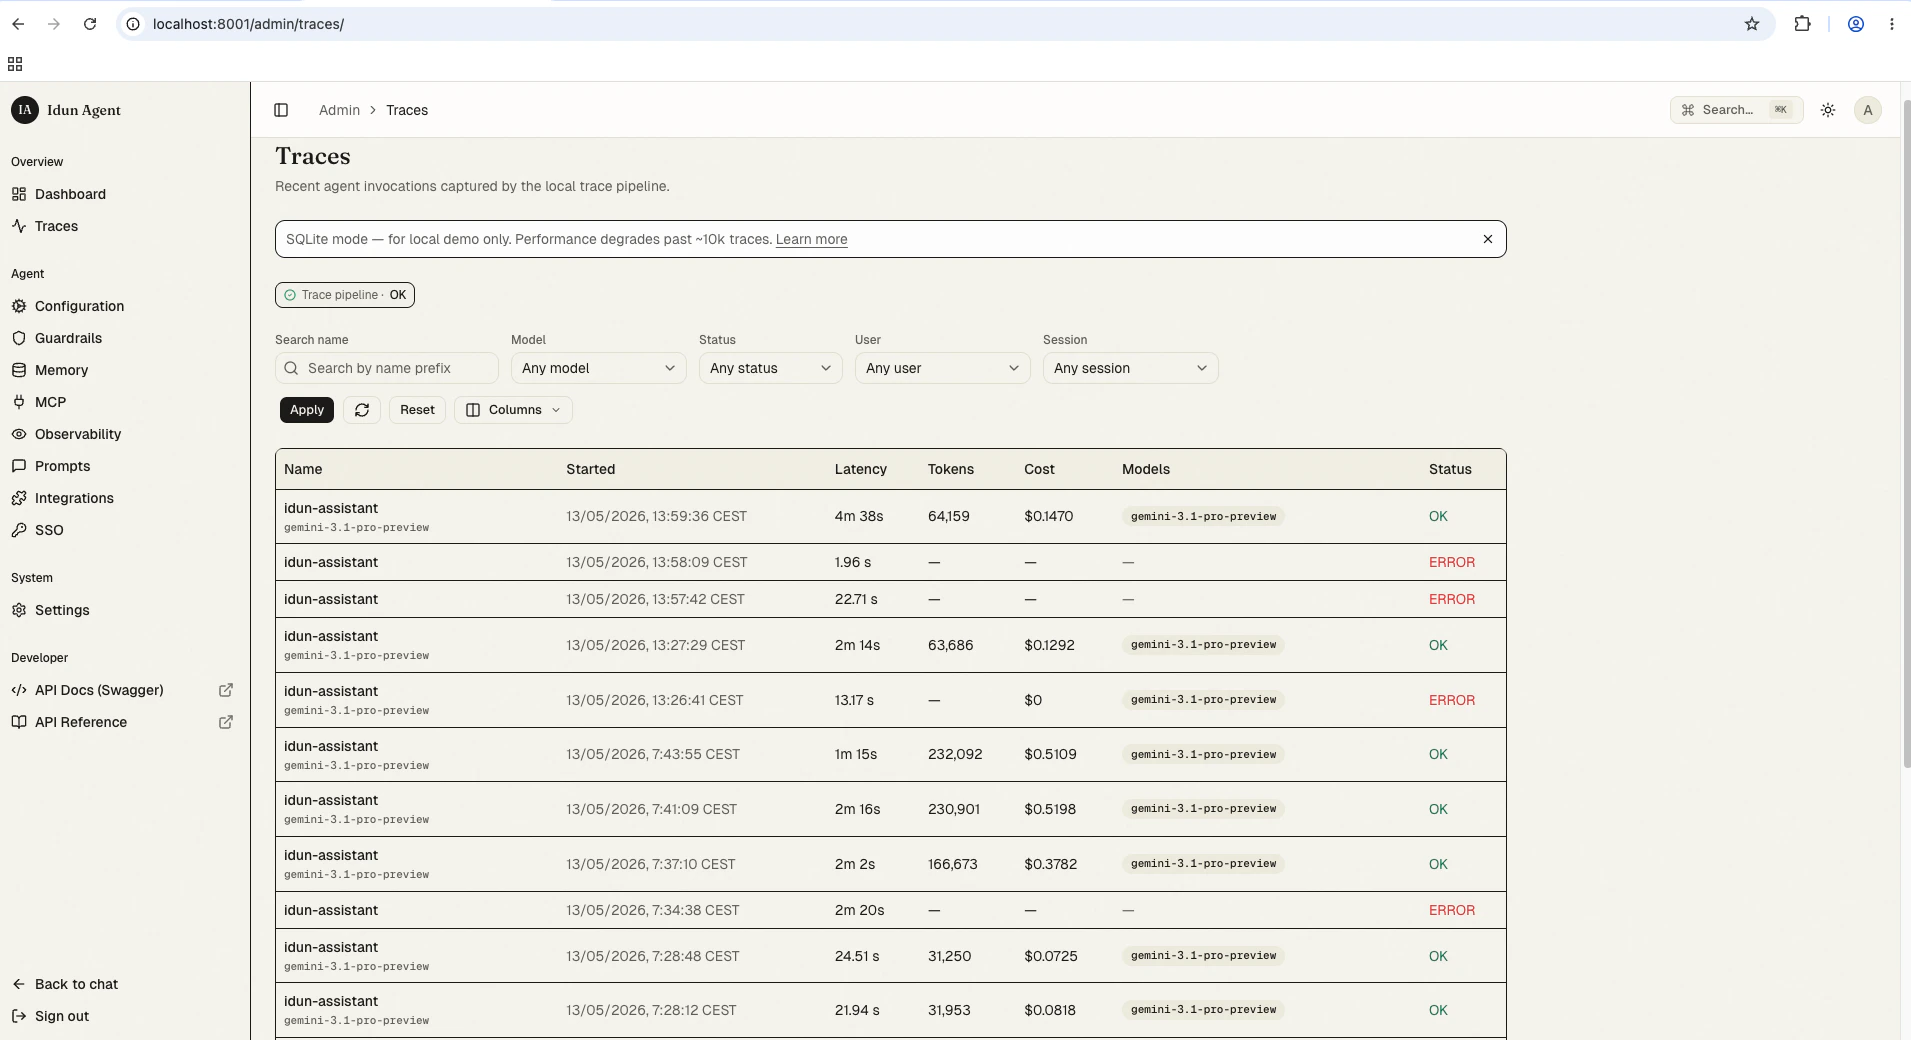 Default columns:
* **Name**: the root span name (typically the agent or graph entry point).
* **Started at**: wall-clock timestamp.
* **Latency**: end-to-end duration of the trace.
* **Total tokens**: sum across every LLM span in the trace.
* **Total cost**: sum across every LLM span, computed from the LiteLLM model-price snapshot.
* **Model(s)**: distinct models touched in the run.
* **Status**: `ok`, `error`, or `unset`.
Hidden by default, toggleable from the column menu:
* **User ID**: `user.id` projected onto spans by the engine's `using_user(...)` wrapper.
* **Session ID**: `session.id`, auto-promoted from LangGraph's `configurable.thread_id`.
* **Tags**: operator-defined trace metadata.
### Filter shortcuts
Above the list, you can filter by:
* **Time range**: last 1 hour, 24 hours, 7 days, custom.
* **Model**: array-contains match against the trace's denormalised `models` column.
* **Status**: `ok` / `error` / `unset`.
* **User**: exact match on `user.id`.
* **Session**: exact match on `session.id`.
* **Free-text search**: searches span names. Postgres uses `pg_trgm`; SQLite uses prefix `LIKE`. Document character cap: 256.
## Trace detail view
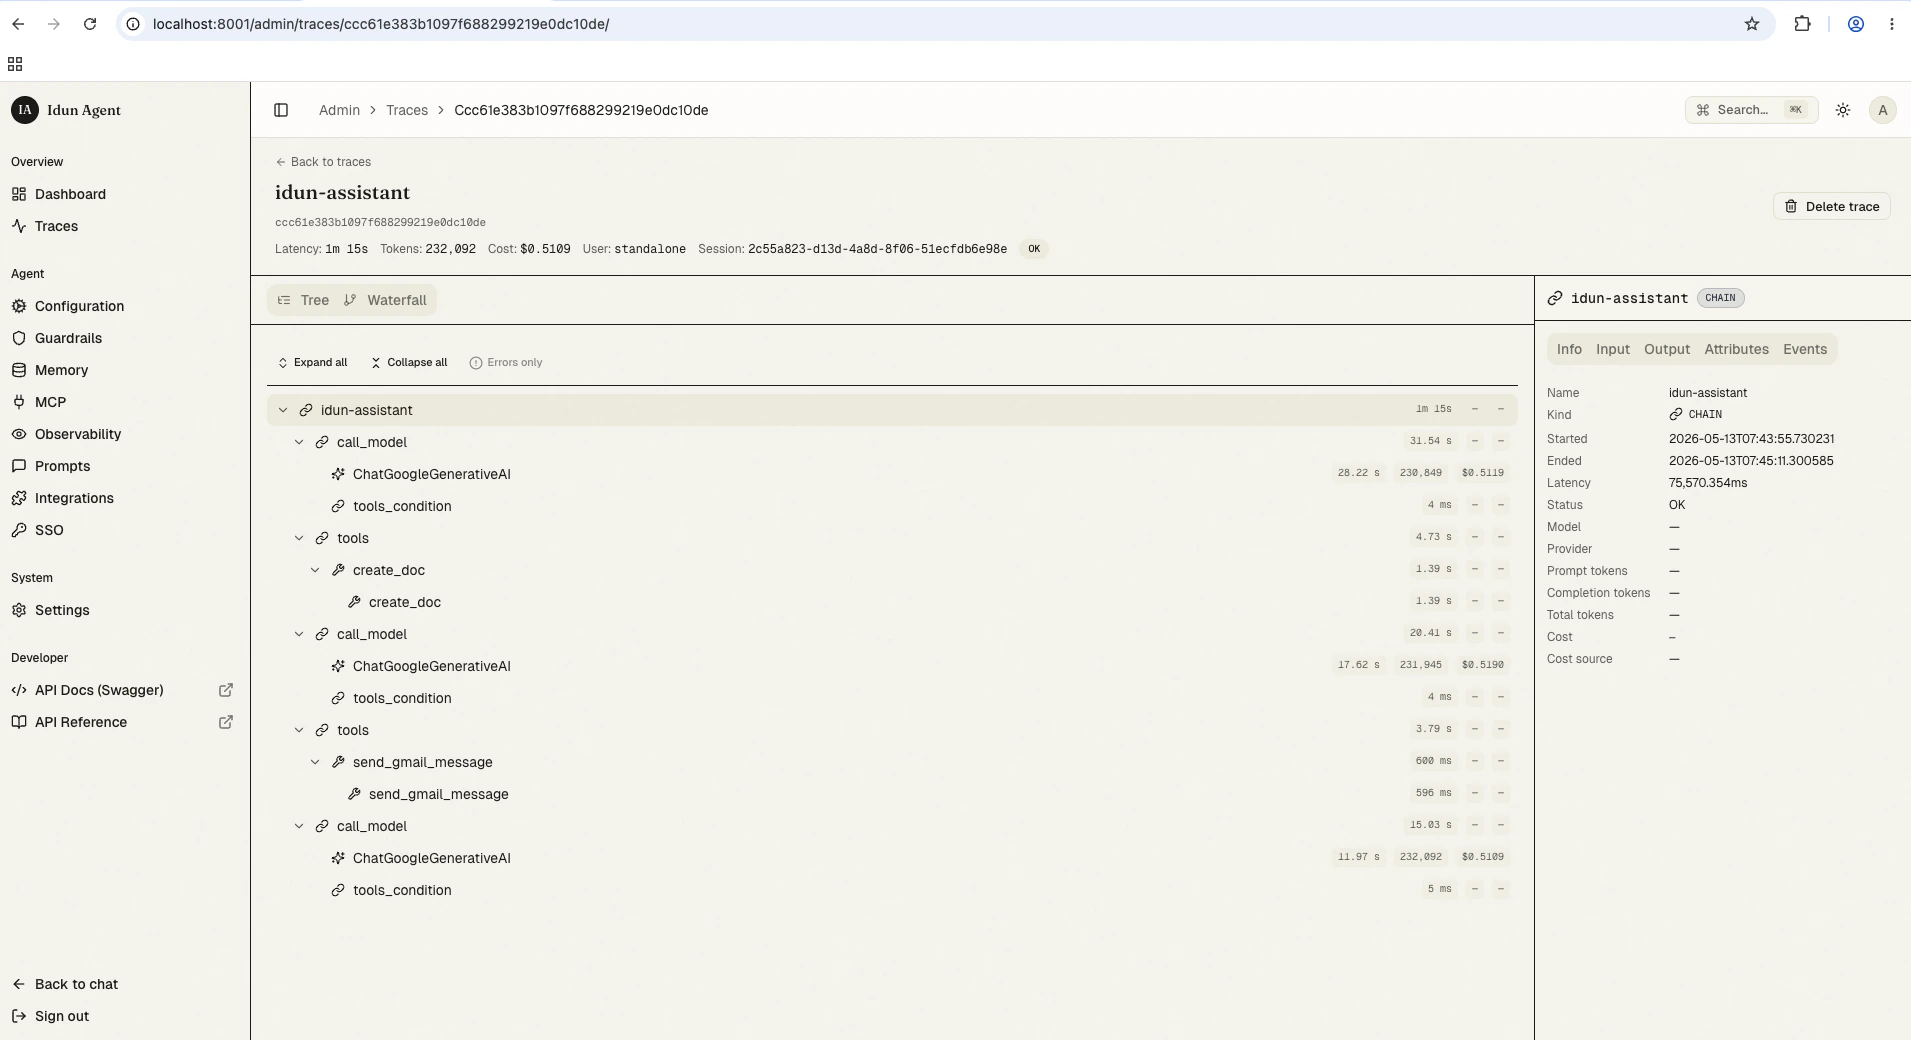
Click a row to open the trace detail. The layout has three panels:
1. **Span tree** (left): collapsible hierarchical view, one row per span, with kind icon, latency, token, and cost badges.
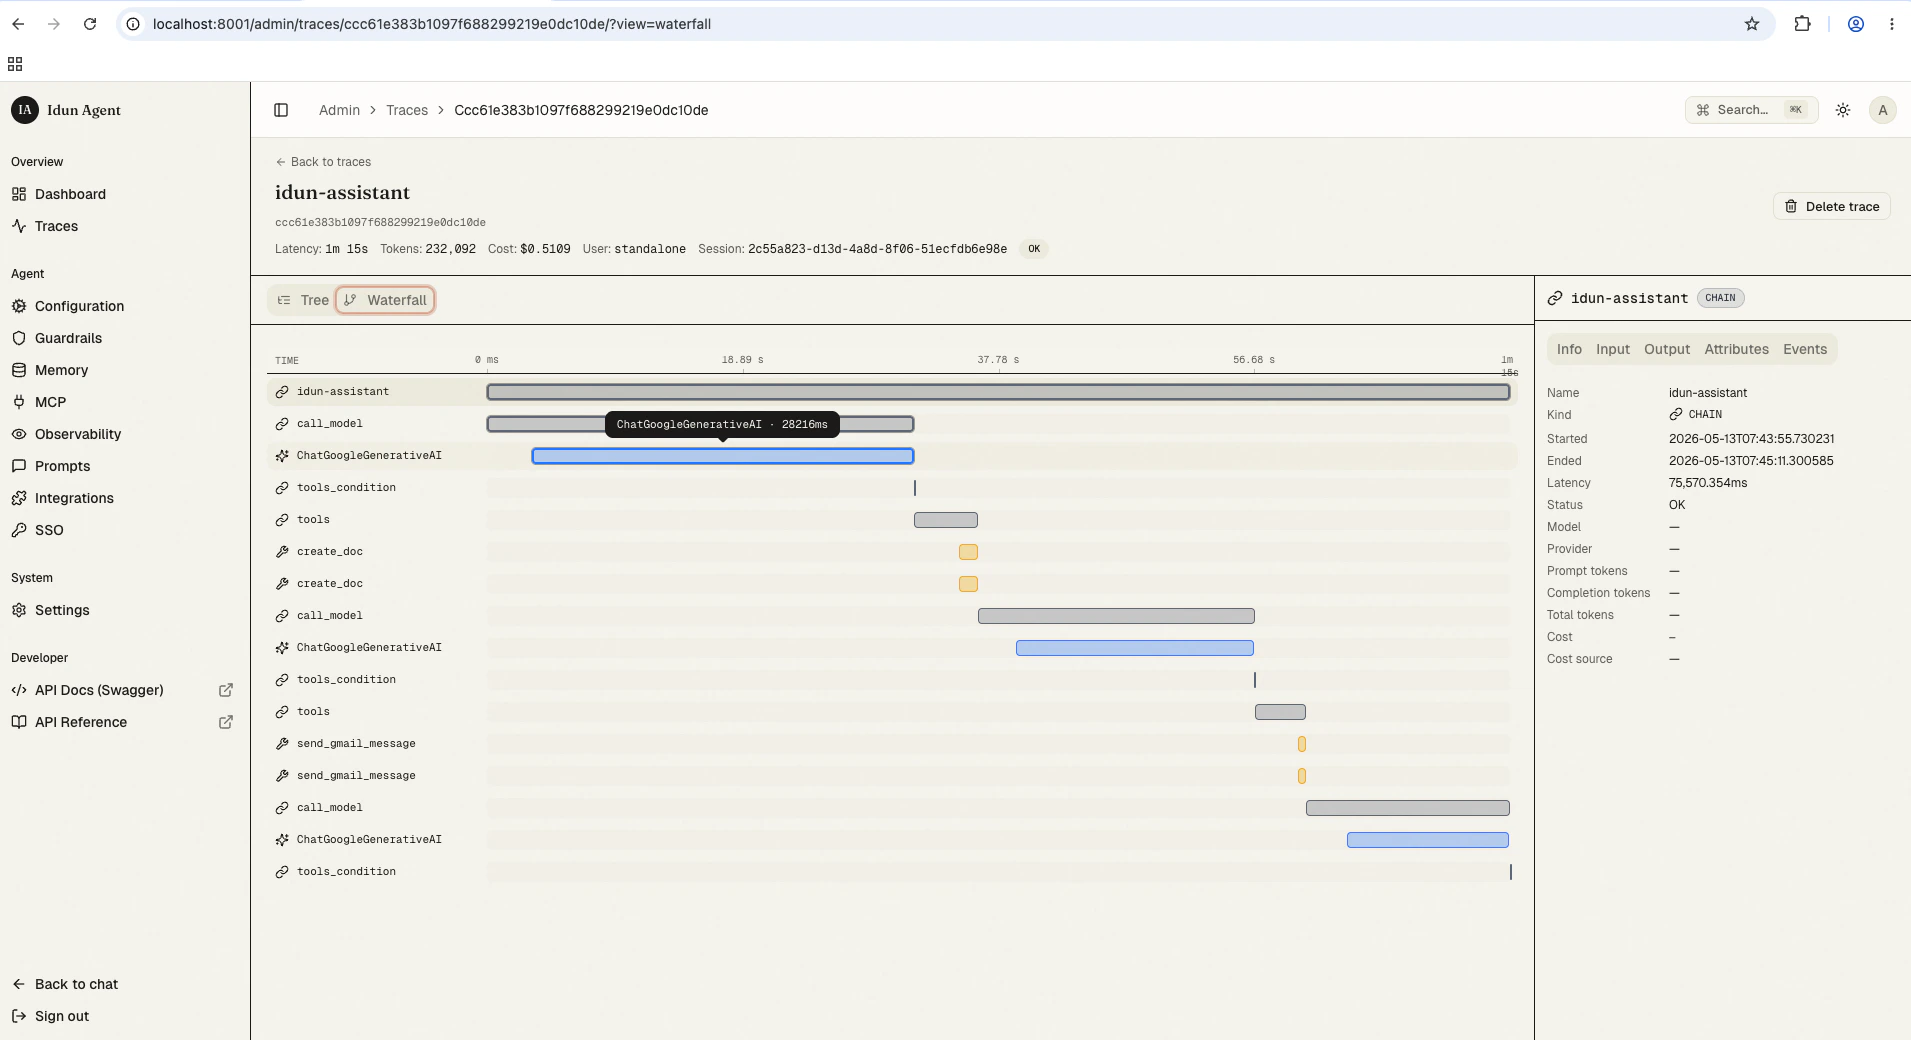
2. **Waterfall** (top-right): horizontal duration bars, percentage-positioned, with the critical path highlighted.
3. **Right rail** (bottom-right): the selected span's detail with five tabs: **Info**, **Input**, **Output**, **Attributes**, **Events**.
Default columns:
* **Name**: the root span name (typically the agent or graph entry point).
* **Started at**: wall-clock timestamp.
* **Latency**: end-to-end duration of the trace.
* **Total tokens**: sum across every LLM span in the trace.
* **Total cost**: sum across every LLM span, computed from the LiteLLM model-price snapshot.
* **Model(s)**: distinct models touched in the run.
* **Status**: `ok`, `error`, or `unset`.
Hidden by default, toggleable from the column menu:
* **User ID**: `user.id` projected onto spans by the engine's `using_user(...)` wrapper.
* **Session ID**: `session.id`, auto-promoted from LangGraph's `configurable.thread_id`.
* **Tags**: operator-defined trace metadata.
### Filter shortcuts
Above the list, you can filter by:
* **Time range**: last 1 hour, 24 hours, 7 days, custom.
* **Model**: array-contains match against the trace's denormalised `models` column.
* **Status**: `ok` / `error` / `unset`.
* **User**: exact match on `user.id`.
* **Session**: exact match on `session.id`.
* **Free-text search**: searches span names. Postgres uses `pg_trgm`; SQLite uses prefix `LIKE`. Document character cap: 256.
## Trace detail view
Click a row to open the trace detail. The layout has three panels:
1. **Span tree** (left): collapsible hierarchical view, one row per span, with kind icon, latency, token, and cost badges.
2. **Waterfall** (top-right): horizontal duration bars, percentage-positioned, with the critical path highlighted.
3. **Right rail** (bottom-right): the selected span's detail with five tabs: **Info**, **Input**, **Output**, **Attributes**, **Events**.
 Toggle to **Waterfall** to see the same spans as a timing chart with the critical path highlighted:
 The **Input** and **Output** tabs render chat messages as bubbles by default with a Pretty/Raw JSON toggle. Tool calls appear as structured cards. The **Attributes** tab shows the raw OpenInference attribute map.
### Span-kind icons
The trace UI renders the full set of nine OpenInference span kinds. Each has a distinct icon and a tooltip describing the semantic.
| Kind | Meaning |
| ----------- | --------------------------------------------------------------------------- |
| `LLM` | A call to a language model. Token counts and cost land here. |
| `EMBEDDING` | A call to an embedding model. |
| `CHAIN` | A composite step (LangChain `RunnableSequence`, LangGraph node grouping). |
| `RETRIEVER` | A vector-store or similar retrieval step. |
| `RERANKER` | A reranker model call. |
| `TOOL` | A tool invocation. Arguments live in `output.value` JSON (LangChain quirk). |
| `AGENT` | An agent-level step (e.g. ReAct agent loop). |
| `GUARDRAIL` | A guardrail check. |
| `EVALUATOR` | An evaluator step (rare in v1; reserved for the eval feature). |
### Streaming-cost prefix
Spans with `cost_breakdown.partial = true` render their cost with a leading `~`, for example `~$0.0042`. Hovering shows the tooltip "Approximate. Streaming response dropped detail buckets, computed from headline prompt tokens only." This catches OpenAI streaming completions under LangChain, which drop the `*_details` buckets and so cannot be costed exactly.
These approximate costs still aggregate into the trace-level total. Treat trace totals on a streaming-heavy workload as a lower-bound estimate.
### Truncated payloads
Long `input.value` / `output.value` strings are truncated at 64 KB by default. Truncated values display a "truncated" badge and the original byte length. Tune the cap via `IDUN_TRACES_INPUT_VALUE_MAX_BYTES`.
## Trace pipeline health panel
The admin UI exposes a small panel showing the trace pipeline's runtime health: queue depth and dropped-span count.
* **Queue depth**: number of spans buffered between the engine's `BatchSpanProcessor` and the asyncio writer task. Normal values stay near zero. A non-trivial steady-state queue depth means the writer is falling behind.
* **Drop count**: number of spans dropped by the bounded queue under sustained backpressure (drop-oldest policy). A non-zero count means input span rate exceeds the writer's drain rate.
Sustained drops or a climbing queue depth on Postgres point at one of:
* Span rate above the deployment's headroom (consider tuning `IDUN_TRACES_INPUT_VALUE_MAX_BYTES` down on heavy-payload workloads).
* Network or disk pressure on the database host.
* A worker stuck in slow recovery (check the standalone logs).
On SQLite, sustained drops past a few thousand traces typically mean it is time to switch the deployment to Postgres.
## Retention
Traces are kept for 14 days by default and dropped automatically beyond that. Tune via `IDUN_TRACE_RETENTION_DAYS`.
* **Postgres**: monthly partition rotation. Expired partitions are detached and dropped, and the runtime pre-creates the next two months of partitions on boot.
* **SQLite**: a scheduled `DELETE` runs daily.
## Switching to Postgres
The standalone default is SQLite, which is fine for quickstart, demos, and local dev. For production, switch to Postgres. Past around 10k traces, SQLite list-view latency degrades noticeably, and the trace UI banner reminds you of this when SQLite is the active backend.
See [Switching to Postgres](/quickstart#switching-to-postgres) for the full procedure and the four trace-store environment variables.
## Going beyond the local store
The local trace store is the default floor. If you want richer dashboards, hosted retention, evaluation tooling, or team-shared traces, configure an additional observability provider in the engine's [observability config](/observability/overview):
Open-source observability with per-LLM analytics.
OpenInference-native trace viewer and evaluation suite.
LangChain-native debugging and monitoring.
Distributed tracing inside Google Cloud.
These stack on top of the local store. You always keep the local copy.
The **Input** and **Output** tabs render chat messages as bubbles by default with a Pretty/Raw JSON toggle. Tool calls appear as structured cards. The **Attributes** tab shows the raw OpenInference attribute map.
### Span-kind icons
The trace UI renders the full set of nine OpenInference span kinds. Each has a distinct icon and a tooltip describing the semantic.
| Kind | Meaning |
| ----------- | --------------------------------------------------------------------------- |
| `LLM` | A call to a language model. Token counts and cost land here. |
| `EMBEDDING` | A call to an embedding model. |
| `CHAIN` | A composite step (LangChain `RunnableSequence`, LangGraph node grouping). |
| `RETRIEVER` | A vector-store or similar retrieval step. |
| `RERANKER` | A reranker model call. |
| `TOOL` | A tool invocation. Arguments live in `output.value` JSON (LangChain quirk). |
| `AGENT` | An agent-level step (e.g. ReAct agent loop). |
| `GUARDRAIL` | A guardrail check. |
| `EVALUATOR` | An evaluator step (rare in v1; reserved for the eval feature). |
### Streaming-cost prefix
Spans with `cost_breakdown.partial = true` render their cost with a leading `~`, for example `~$0.0042`. Hovering shows the tooltip "Approximate. Streaming response dropped detail buckets, computed from headline prompt tokens only." This catches OpenAI streaming completions under LangChain, which drop the `*_details` buckets and so cannot be costed exactly.
These approximate costs still aggregate into the trace-level total. Treat trace totals on a streaming-heavy workload as a lower-bound estimate.
### Truncated payloads
Long `input.value` / `output.value` strings are truncated at 64 KB by default. Truncated values display a "truncated" badge and the original byte length. Tune the cap via `IDUN_TRACES_INPUT_VALUE_MAX_BYTES`.
## Trace pipeline health panel
The admin UI exposes a small panel showing the trace pipeline's runtime health: queue depth and dropped-span count.
* **Queue depth**: number of spans buffered between the engine's `BatchSpanProcessor` and the asyncio writer task. Normal values stay near zero. A non-trivial steady-state queue depth means the writer is falling behind.
* **Drop count**: number of spans dropped by the bounded queue under sustained backpressure (drop-oldest policy). A non-zero count means input span rate exceeds the writer's drain rate.
Sustained drops or a climbing queue depth on Postgres point at one of:
* Span rate above the deployment's headroom (consider tuning `IDUN_TRACES_INPUT_VALUE_MAX_BYTES` down on heavy-payload workloads).
* Network or disk pressure on the database host.
* A worker stuck in slow recovery (check the standalone logs).
On SQLite, sustained drops past a few thousand traces typically mean it is time to switch the deployment to Postgres.
## Retention
Traces are kept for 14 days by default and dropped automatically beyond that. Tune via `IDUN_TRACE_RETENTION_DAYS`.
* **Postgres**: monthly partition rotation. Expired partitions are detached and dropped, and the runtime pre-creates the next two months of partitions on boot.
* **SQLite**: a scheduled `DELETE` runs daily.
## Switching to Postgres
The standalone default is SQLite, which is fine for quickstart, demos, and local dev. For production, switch to Postgres. Past around 10k traces, SQLite list-view latency degrades noticeably, and the trace UI banner reminds you of this when SQLite is the active backend.
See [Switching to Postgres](/quickstart#switching-to-postgres) for the full procedure and the four trace-store environment variables.
## Going beyond the local store
The local trace store is the default floor. If you want richer dashboards, hosted retention, evaluation tooling, or team-shared traces, configure an additional observability provider in the engine's [observability config](/observability/overview):
Open-source observability with per-LLM analytics.
OpenInference-native trace viewer and evaluation suite.
LangChain-native debugging and monitoring.
Distributed tracing inside Google Cloud.
These stack on top of the local store. You always keep the local copy.