What the trace store captures
The trace store consumes OpenTelemetry spans emitted by the engine’s existing instrumentation (LangChain, ADK, MCP, guardrails). On boot, the standalone attaches its ownSpanExporter to the engine’s TracerProvider; spans flow through a bounded queue into an asyncio writer, land in the standalone_trace and standalone_span tables, and are served back through /admin/api/v1/traces to the trace UI.
If no observability provider is configured, the runtime self-installs LangChainInstrumentor so spans are still produced. External providers stack on top of the local store: Langfuse and LangSmith ship spans through their own paths while the local store captures the same runs in parallel; Phoenix, GCP Trace, and other OTel-based providers attach to the same TracerProvider as the local exporter and fan out from there.
You always have a local copy.
Trace list view
The list view at Traces shows one row per agent run.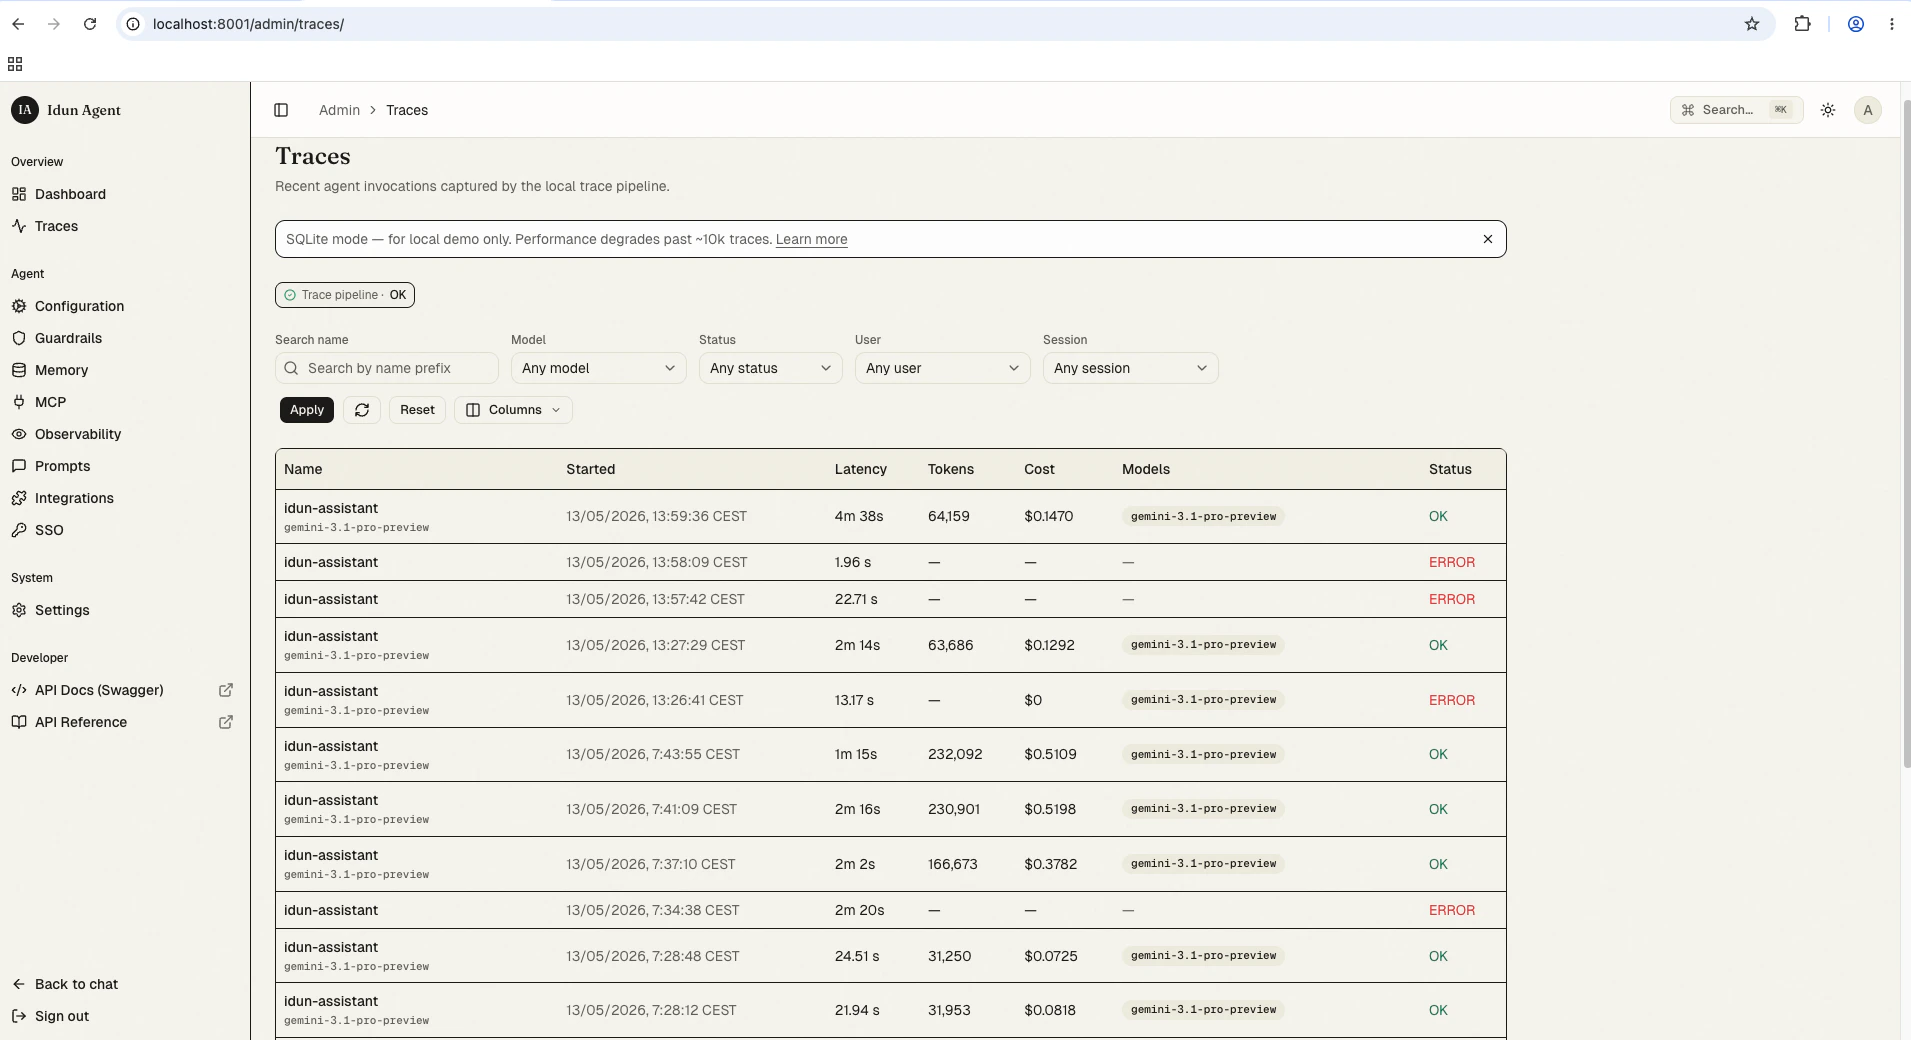
- Name: the root span name (typically the agent or graph entry point).
- Started at: wall-clock timestamp.
- Latency: end-to-end duration of the trace.
- Total tokens: sum across every LLM span in the trace.
- Total cost: sum across every LLM span, computed from the LiteLLM model-price snapshot.
- Model(s): distinct models touched in the run.
- Status:
ok,error, orunset.
- User ID:
user.idprojected onto spans by the engine’susing_user(...)wrapper. - Session ID:
session.id, auto-promoted from LangGraph’sconfigurable.thread_id. - Tags: operator-defined trace metadata.
Filter shortcuts
Above the list, you can filter by:- Time range: last 1 hour, 24 hours, 7 days, custom.
- Model: array-contains match against the trace’s denormalised
modelscolumn. - Status:
ok/error/unset. - User: exact match on
user.id. - Session: exact match on
session.id. - Free-text search: searches span names. Postgres uses
pg_trgm; SQLite uses prefixLIKE. Document character cap: 256.
Trace detail view
Click a row to open the trace detail. The layout has three panels:- Span tree (left): collapsible hierarchical view, one row per span, with kind icon, latency, token, and cost badges.
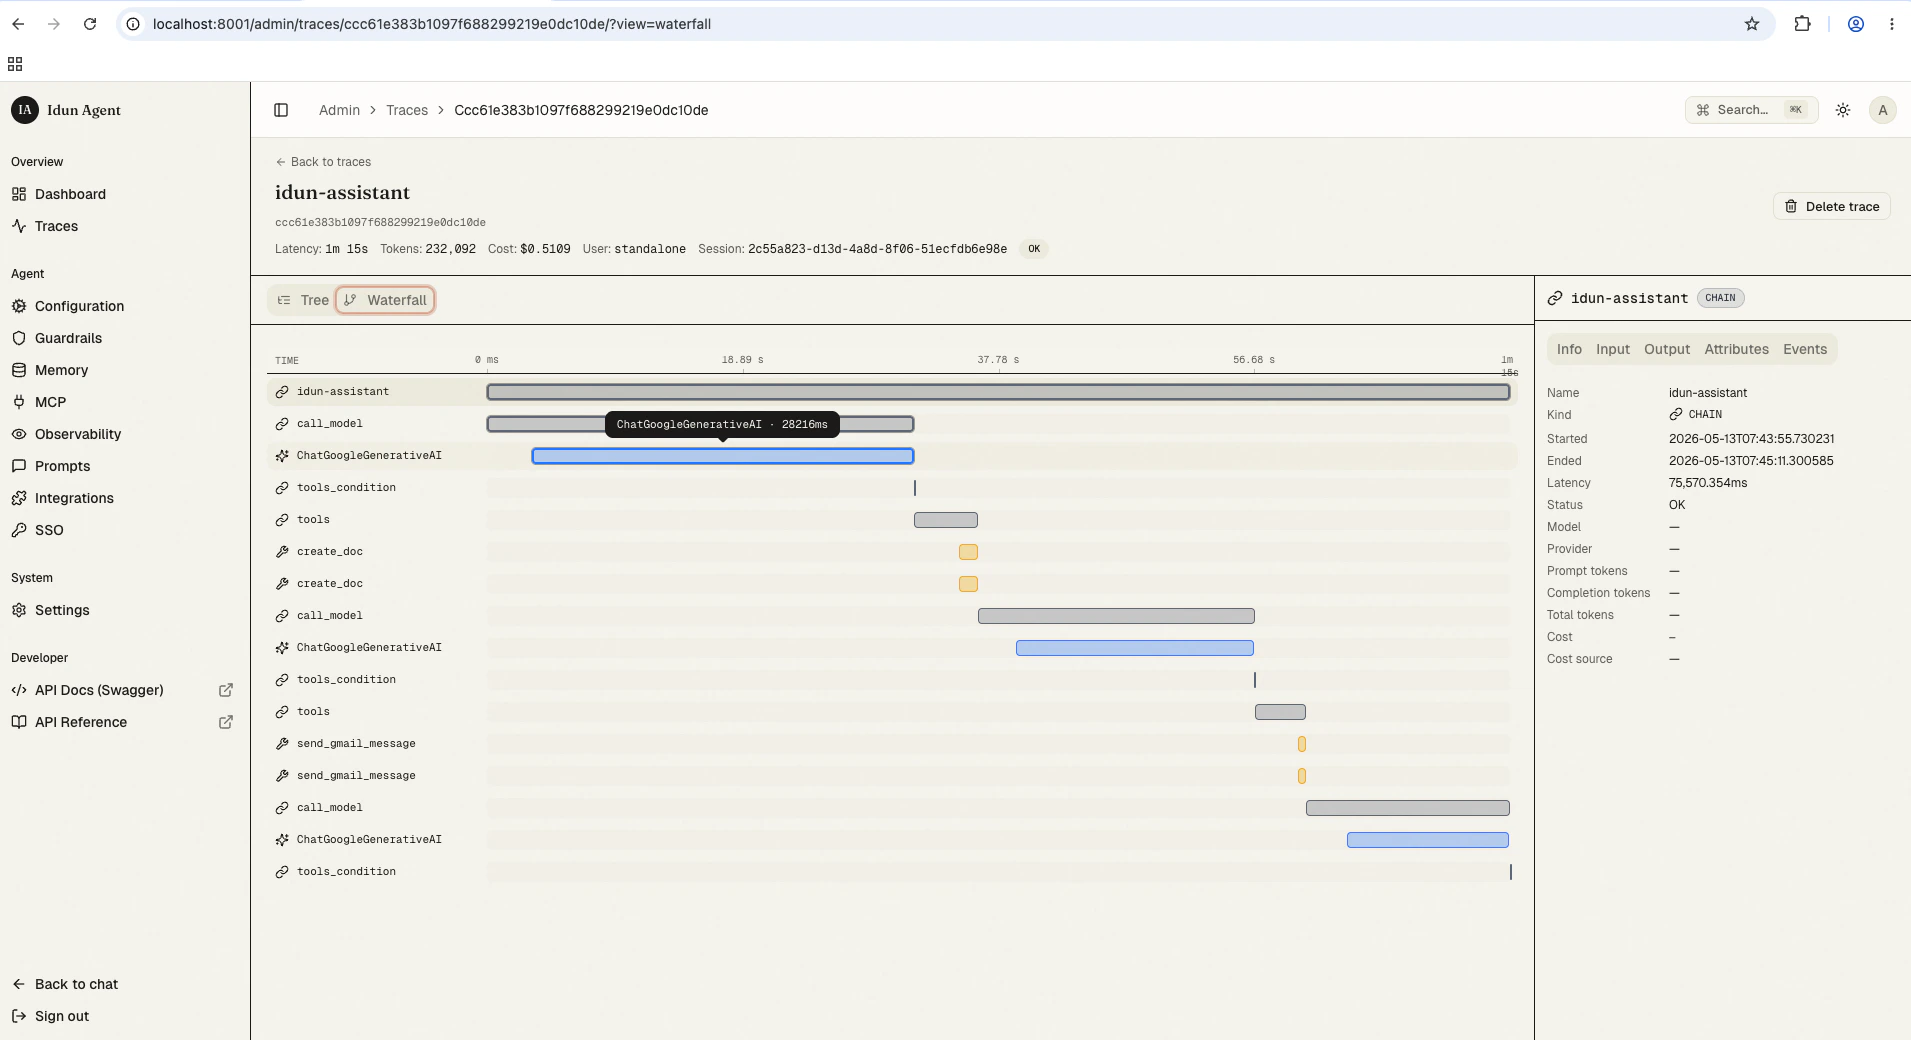
- Waterfall (top-right): horizontal duration bars, percentage-positioned, with the critical path highlighted.
- Right rail (bottom-right): the selected span’s detail with five tabs: Info, Input, Output, Attributes, Events.
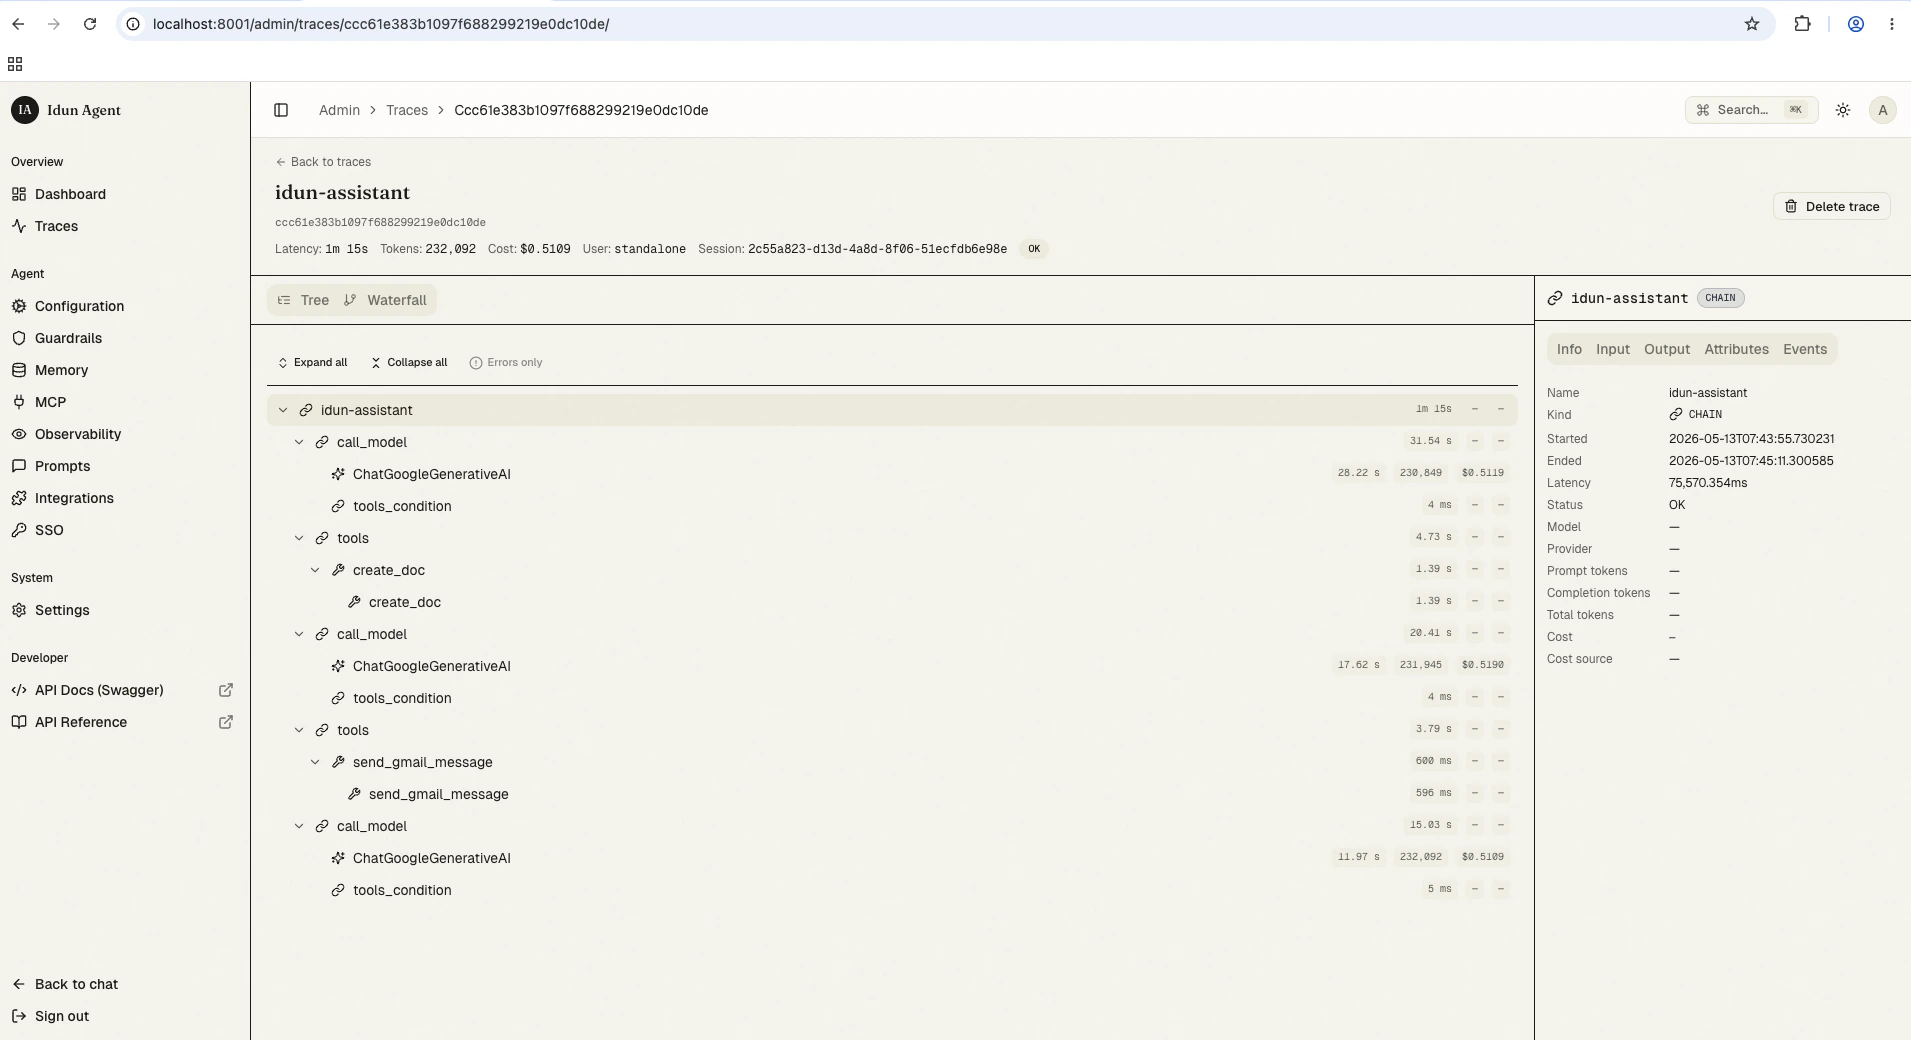
Span-kind icons
The trace UI renders the full set of nine OpenInference span kinds. Each has a distinct icon and a tooltip describing the semantic.Streaming-cost prefix
Spans withcost_breakdown.partial = true render their cost with a leading ~, for example ~$0.0042. Hovering shows the tooltip “Approximate. Streaming response dropped detail buckets, computed from headline prompt tokens only.” This catches OpenAI streaming completions under LangChain, which drop the *_details buckets and so cannot be costed exactly.
These approximate costs still aggregate into the trace-level total. Treat trace totals on a streaming-heavy workload as a lower-bound estimate.
Truncated payloads
Longinput.value / output.value strings are truncated at 64 KB by default. Truncated values display a “truncated” badge and the original byte length. Tune the cap via IDUN_TRACES_INPUT_VALUE_MAX_BYTES.
Trace pipeline health panel
The admin UI exposes a small panel showing the trace pipeline’s runtime health: queue depth and dropped-span count.- Queue depth: number of spans buffered between the engine’s
BatchSpanProcessorand the asyncio writer task. Normal values stay near zero. A non-trivial steady-state queue depth means the writer is falling behind. - Drop count: number of spans dropped by the bounded queue under sustained backpressure (drop-oldest policy). A non-zero count means input span rate exceeds the writer’s drain rate.
- Span rate above the deployment’s headroom (consider tuning
IDUN_TRACES_INPUT_VALUE_MAX_BYTESdown on heavy-payload workloads). - Network or disk pressure on the database host.
- A worker stuck in slow recovery (check the standalone logs).
Retention
Traces are kept for 14 days by default and dropped automatically beyond that. Tune viaIDUN_TRACE_RETENTION_DAYS.
- Postgres: monthly partition rotation. Expired partitions are detached and dropped, and the runtime pre-creates the next two months of partitions on boot.
- SQLite: a scheduled
DELETEruns daily.
Switching to Postgres
The standalone default is SQLite, which is fine for quickstart, demos, and local dev. For production, switch to Postgres. Past around 10k traces, SQLite list-view latency degrades noticeably, and the trace UI banner reminds you of this when SQLite is the active backend. See Switching to Postgres for the full procedure and the four trace-store environment variables.Going beyond the local store
The local trace store is the default floor. If you want richer dashboards, hosted retention, evaluation tooling, or team-shared traces, configure an additional observability provider in the engine’s observability config:Langfuse
Open-source observability with per-LLM analytics.
Arize Phoenix
OpenInference-native trace viewer and evaluation suite.
LangSmith
LangChain-native debugging and monitoring.
Google Cloud Trace
Distributed tracing inside Google Cloud.